Endgame: The Data-Driven Decay of Sports
As Digital and Data collide, the forces of global connectivity, digital convergence, and cultural virtualization are fundamentally transforming sports.
Sport, a universal language brought to life by an industrial complex of massive proportion. Newly-empowered by communication technologies and fueled by digital media, the industrial machinery of Sport has found new life in the emerging Information Age.
But the collision of multiple big data dimensions is generating an exploding atmosphere of athletic data that is more complex, more expansive, and more immersive than any social phenomena ever seen. The Athletic enterprise is in beast-mode, fueled by social media smokestacks, wearable-devices, and other technologies that pour endless amounts of data and noise into the sports landscape.
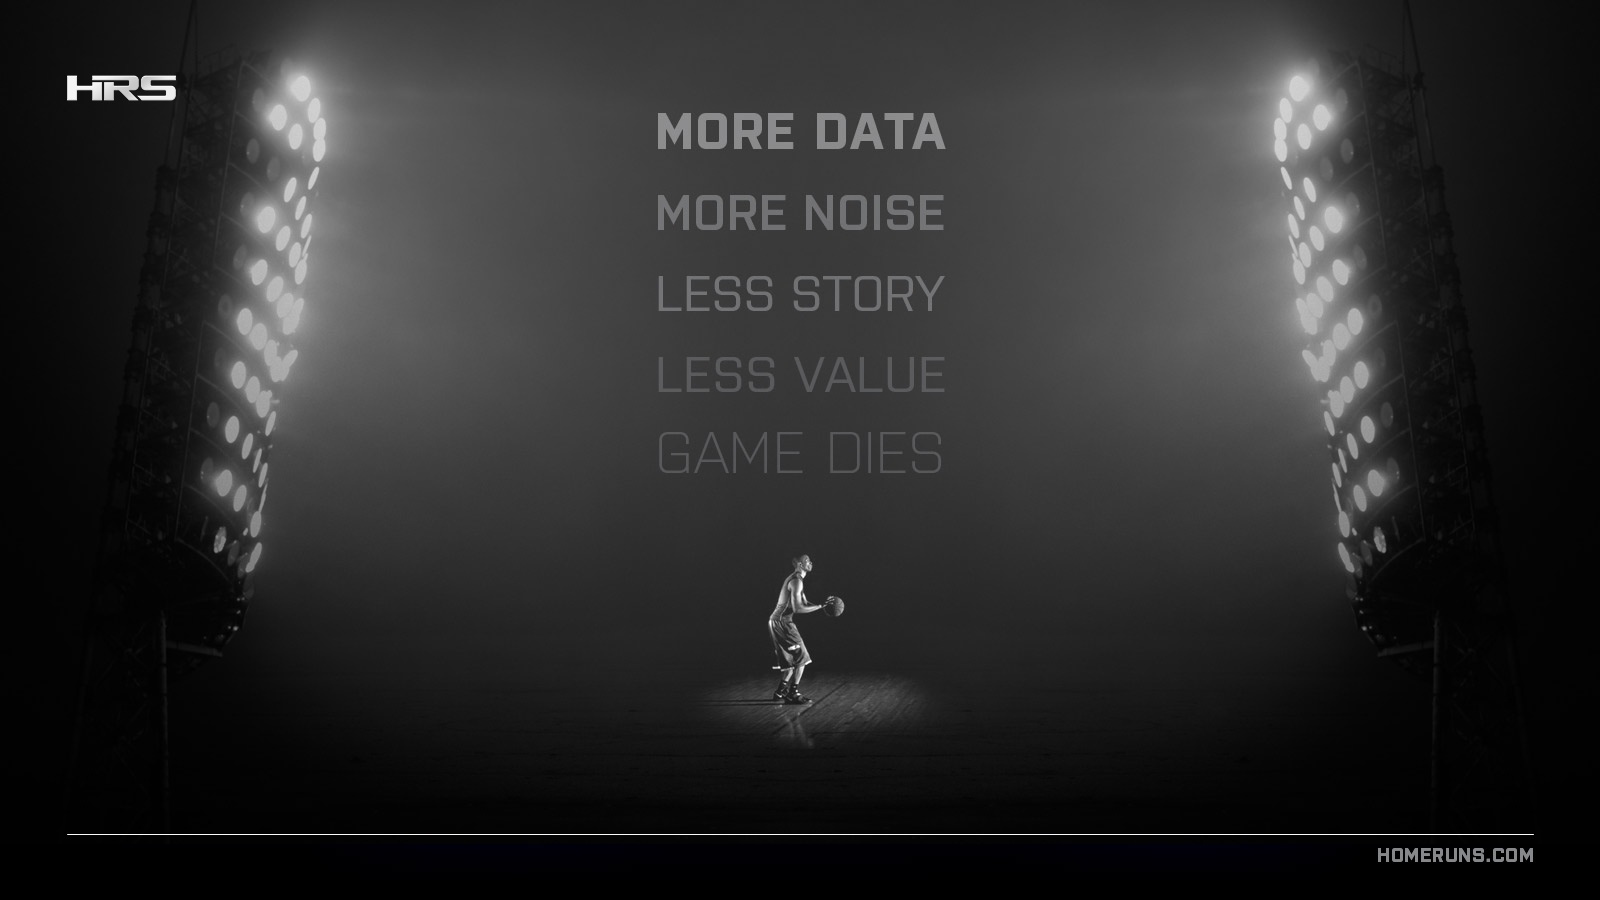
In a process that is gradual and insidious, centuries of tradition, athletic autonomy, and cultural integrity are beginning to erode as the inner story of sports becomes subsumed by the outer story of fan-first economics.
Without this inner story, the social economies of Sport cease to create value. Media are reduced to cheap popular advertainment and global spectacle. Athletes are reduced to quantified data sets. Experiences become fast food entertainment.
And the stories that define our identities and shape our values become lost in the darkness of big data.
Welcome to the Athletic Enterprise
Through the lens of big data, there is no sports industry.
Sport is an essential component of economic society, providing identities, experiences, and narratives that instill values, organize people, and create opportunities for advancement. It is not confined to a single sector, but woven into the very fabric of our civilization.
In this context, there is no “industry,” but rather an enterprise of epic proportions.
The Athletic Enterprise is something deeply-human, brought to life by a culture complex of individuals, networks, and economies that span all sectors of global society.
The primary output of this enterprise is data – from everywhere, everyone, and everything. With big data, the old ways of understanding sports are gone.
But the Athletic Enterprise is complex. Multiple stakeholders, including individuals (participants, personnel, audiences), organizations (teams, leagues, brands), and industries (events, media, retail) operate with relative autonomy in this highly-fragmented landscape, each with different interests and business incentives.
Every entity within this densely-layered web generates massive pools of diverse data, most of which typically remain unconnected in silos or unstructured in networks. Despite this, the Athletic Enterprise’s adoption of technology has always been spectacular – sports are always undergoing waves of big-data-esque transformations (moneyball, social media, wearable tech).
The difference now is these waves are all colliding at once as the digital world converges.
Driven by fame and finance, the quantified athlete seems to be a very logical extension of the quantified self… Professional athletes are the living embodiment of the quantified self in that they are measured, assessed, tracked, tested and monitored on a daily basis. – John Nosta, Forbes
The Dawn of the Athletic DataSphere
The entire athletic experience is now taking place within a massive and explosive evolution in how we use, store, and transmit information.
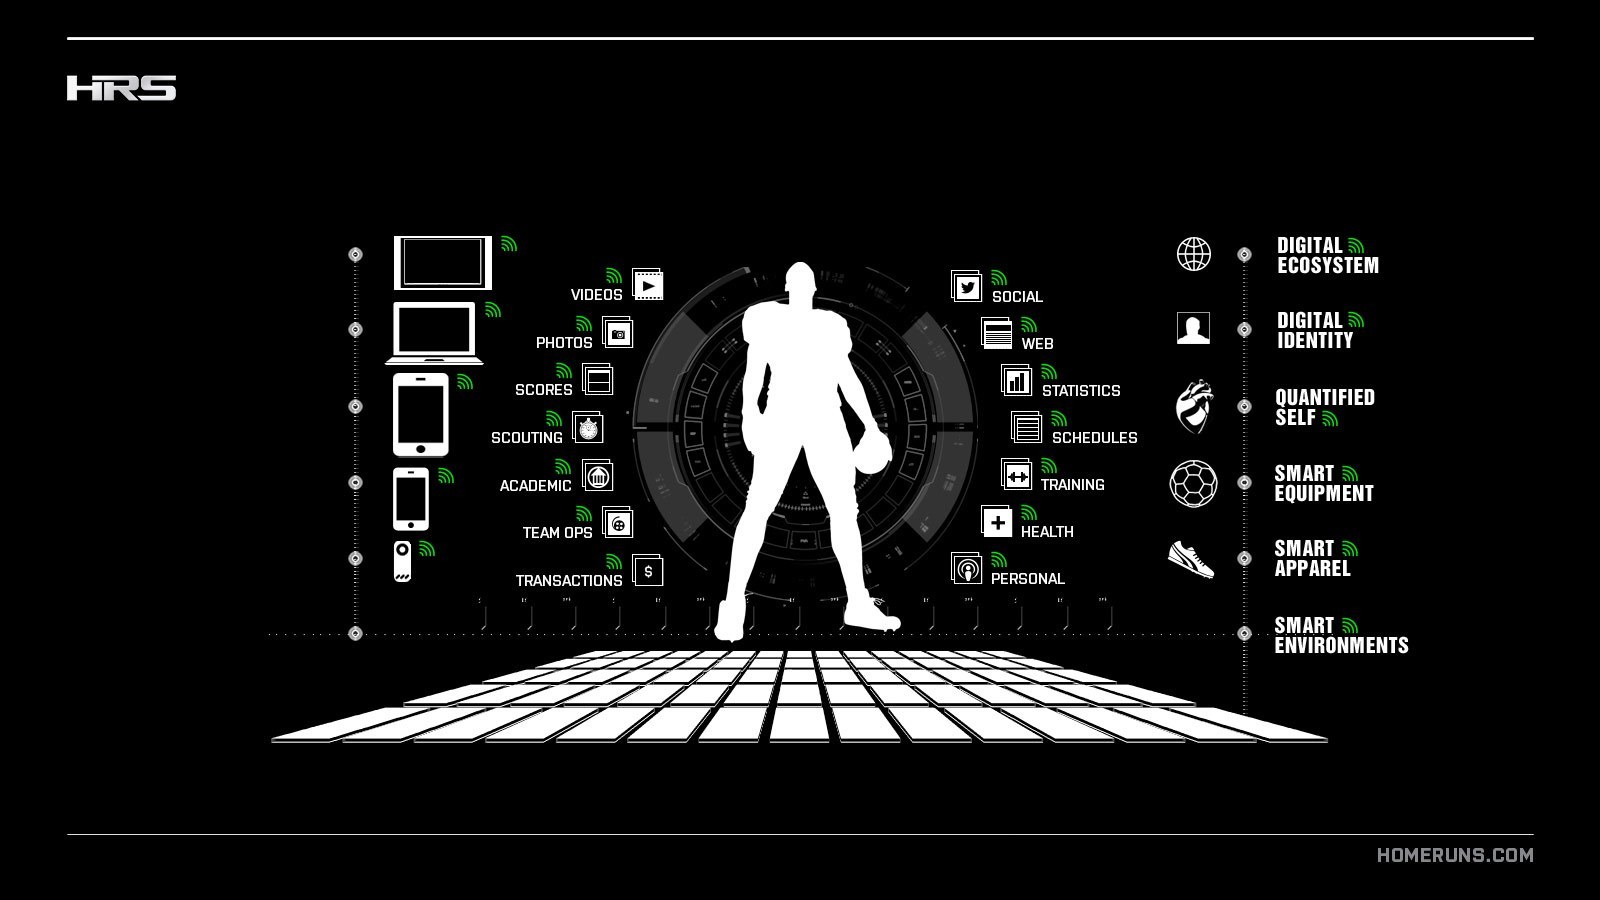
The Athletic DataSphere has arrived, and it is highly-fragmented, socially-complex, and poorly-understood. This is not just traditional sports data like stats and highlights, but rather an entirely new dimension encompassing everything and everyone involved in the athletic experience.
Dimensions of the Athletic DataShpere include:
- Videos, Photos, Audio
- Social, Web, Content
- Statistics, Scores, Schedules
- Coaching, Scouting, Recruiting
- Academic, Student, Institution
- Healthcare, Medicine, Nutrition
- Training, Fitness
- Business Operations, Marketing, Consumer
- Public Records, Open Data
- Biometrics, Wearables, Sensors
- Personal Identity, Social Connections
With multiple big data dimensions exploding at once, there’s simply too much data, media, and information to aggregate, organize, and make sense of.
Despite the big data hype, the Athletic Enterprise is not designed to handle this type of exploding data – it is simply impossible to manually assemble disparate data into actionable assets quick enough to create real-time value or deep enough to create long-term growth.
This is the real “big data,” and it represents a different species of change. This is not television-to-internet big but oral-to-written-history big. It is a transformation of culture, of time and space, of reality.
An Economy of Distraction Provides an Illusion of Depth
Nowhere is the concept of big data more misunderstood than in sports. It’s what psychologists call the “illusion of explanatory depth” – we think we understand something more than we do. Of course we know sports, they’re everywhere.
But the science of Sport is surprisingly complex and greatly miscomprehended.
Unable to grasp the magnitude of the shifts underway, and unable to see the Athletic Enterprise and DataSphere in their entirety, the majority of people fail to understand that innovation in sports means changing the cultural fabric of society.
In 2014, the World Economic Forum stated that “data are now the equivalent of oil or gold. And today we are seeing a data boom rivaling the Texas oil boom of the 20th century and the San Francisco gold rush of the 1800s.”
But initially, this oil was fueling lamps, not economies. Originally brought to market as kerosene, this exciting “new light” pushed the “night back” and increased the work day. Gasoline was simply a by-product of the refinement process, and the real transformation came many years later with the development of the combustion engine.
The effect of nowness resembles the effect of light pollution in large cities, which make it impossible to see the stars. A flood of information about the present shuts out the past. – David Gelernter, Computer Scientist, Yale University
This is where we’re at in sports – fascinated by the bright new light, unaware of what we don’t know. And so the conversation about data and sports is always about enhancement, not transformation.
Like oil, data needs to be activated in order to have value. And because information is the raw material of the 21st century economy, technologies and architectures that extract value from data can trigger explosive growth.
But to activate this potential, complex ecosystems like sports need third-party entities to provide critical value-added functions. The only problem: this is an industry of Gods and Gatekeepers.
An Inevitable Plateau of Profitability
Sports are situated at the nexus of tectonic shifts in new media, big data, and digital commerce – forces that all experts agree hold massive, transformative potential.
But where is this massive growth actually coming from?
How much better can athletes get? Even if individuals, teams, and leagues achieve optimal performance, the Enterprise as a whole isn’t growing. If I win every game and make every shot, my brand value may grow, but the enterprise as a whole isn’t growing.
The best becoming the best reflects efficiency, not growth. Accelerated recruiting, sport specialization, and advanced systems of training have eliminated the hidden gem and optimized talent acquisition and development, meaning the system is already in place to maximize potential.
There is also competition between sports for talent, between properties for attention, and between sports programs and other social services. One more football player means one less soccer player. More watching ESPN mean less watching CBS. Limited resources (participants, attention, capital) mean zero-sum growth.
Sports are already operating at near peak capacity in physical space – “big” growth is not possible from adding new leagues, teams or athletes, building stadiums, or expanding schedules.
Calendar constraints and real-time packaging limit opportunities to expand event-based revenue, monopoly leagues have no threat of competitive entry, and colleges are established institutions.
The fantasy sports boom is beginning to slow, signaling a ceiling to its use as an economic driver, and every brand is becoming a publisher generating additional layers of digital content which, in turn, creates more noise.
Meanwhile, youth participation is declining at an alarming rate.
The impact of the global economic downturn on sport has certainly started, and we find ourselves somewhere in the middle of what is rapidly becoming the most unprecedented situation facing the new world of commercialized, globalized sport. – Dr. Simon Chadwick, Chair of Sport Business Strategy and Marketing, Coventry University Business School
Today’s Athletes Are Tomorrow’s Fans
From 2008 to 2012, Twitter went from generating 300,000 to 175,000,000 tweets a day. Combined with Facebook, YouTube, and other new media channels, the DataSphere began to grow.
During that same time, youth sports participation dropped 9%. The combined participation in the four most-popular U.S. team sports – basketball, soccer, baseball and football – fell among boys and girls aged 6 through 17 by roughly 4%. The number of kids playing Little League baseball dropped nearly 7% percent. Football, -5%. Basketball, -6%.
Declining participation is a death knell for long-term sport equity.
6 out of 10 kids play sports. 6 out of 10 adults are fans. You do the math.
This is the canary in the landmine.
Despite the success of major media conglomerates, monopoly leagues, and big businesses at the apex of sports, despite the real-time spectacle and bright shiny objects, the Game is decaying from within as the Athletic DataSphere begins to explode.
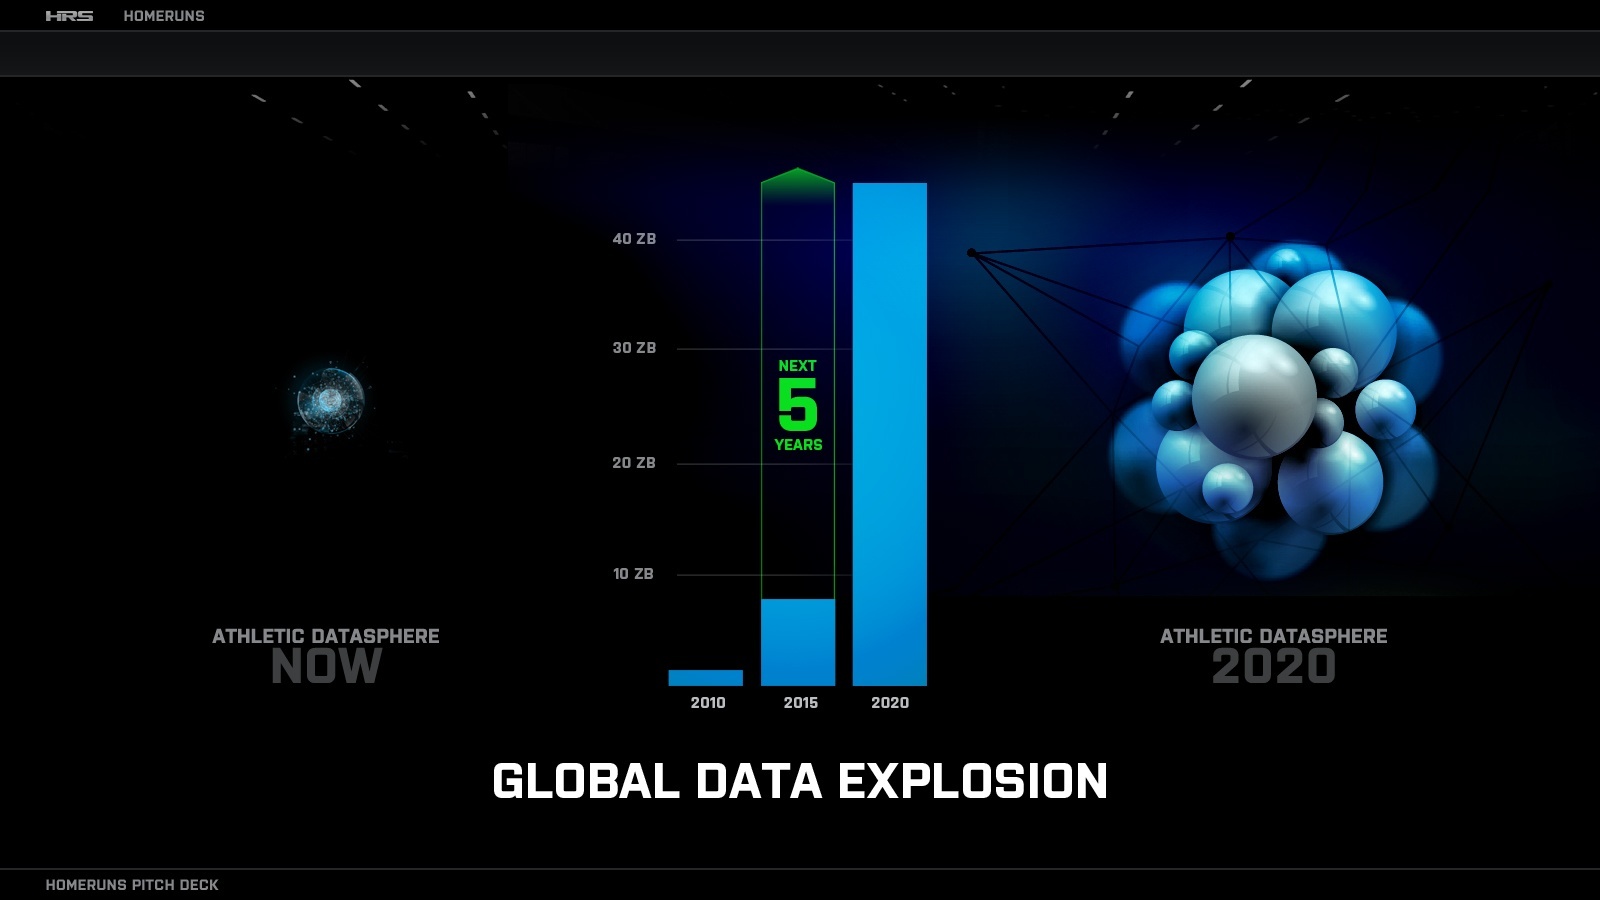
With global data expected to grow 40x over the next five years, creating real, long-term, cross-sector value out of information is a serious problem.
What we’re witnessing is the emergence of a new form of narrative that’s native to the Internet. Told through many media at once in a nonlinear fashion, these new narratives encourage us not merely to watch but to participate, often engaging us in the same way that games do. This is “deep media”: stories that are not just entertaining but immersive… – Frank Rose, The Art of Immersion
Story is the Cultural Technology That Drives Growth
Story is the engine that creates value and drives growth. Technologies that truly transform sports do so because they increase storytelling capacity.
Historically, every increase in the popularity of sports has taken hold through an increase in the capacity to convey stories. Sports and media have a symbiotic relationship, and more storytelling has always meant more popularity and more profitability.
The entire value system of sports, from participation and fandom to branding and business, ultimately depends on one thing: the capacity to produce and consume story. The ability to grow – to attract more participants and fans, to plan more events, to attract more coverage, to increase sponsorship space, to increase brand equity – is wholly dependent on a capacity to generate a individual and collective narratives around the game.
Digital Gridlock
But market complexity is inhibiting agility, innovation, and collaboration. As other sectors harness the power and potential of big data, athletic identities, experiences, and economies remain linear, analog, and abstract. The industry isn’t calibrated for transmedia storytelling.
Storymaking (creating legacy), storytelling (crafting legacy), and storybranding (connecting legacies) in sports represent industrial age systems, creating analog value in a new digital world.
And because TV is the money game, the entire industry has over-invested in a cultural technology that limits long-term growth potential and is ill equipped to capitalize on emerging technologies.
While key stakeholders protect their assets in the new Digital Ecosystem, limited resources (athletes, events, attention), digital gridlock (media rights, market complexity, emerging tech), and data-driven decay (more noise than story) signal an inevitable plateau of profitability.
But if sports can make the transition from a real-time entertainment product to a timeless cultural experience, and if big data can be used to create a new, deeper, monetizable story space, then stakeholders have the ability to fuel growth across the full Athletic Enterprise, fostering a new era for modern sport.
Overview of A Sports Ecosystem
Elements Of A Sport Ecosystem
- Sport Governance
- Sports Infrastructure
- Talent Scouting & Athletic Training
- Training of Trainers
- Sports Equipment
- Teams, Leagues, & Tournaments
- Performance Incentives
Segment: Stakeholder Sectors
- Manufacturing
- Retail
- Sports Apparel, Equipment, Footwear
- Pro Sports
- Recreational, Amateur, Youth Sports
- High School and College Athletics
- Outdoor Sports
- Sports Marketing
- Sport Sponsorship
- Governing Bodies
- Sport Academies
- Sport Academies
Segment: Stakeholder Contexts
- Performance
- Production
- Promotion
Segment: Stakeholder Types
- Private
- Public-Private
- Government
- Autonomous Governing Bodies
Segment: Stakeholder Roles
- Athletic (Athlete, Coach, Executive)
- Media
- Fan
- Sponsor
- Advertiser
- Licensee
Primary Modes of Return (ROI/ROO/ROT)
- Health promotion, disease prevention, national health
- Promotion of social equality
- Social integration and the development of social capital
- Peace building and conflict prevention/resolution
- Post-disaster/trauma relief and normalization of life
- Economic development
- Community development – health, crime, employment, education
- Opportunity to progress and develop skills and expertise
- Opportunity to move from recreational participation to competition
- Training and support of leaders and coaches
- Establishment of links between schools, sports clubs, and the wider community
Youth
Overall Participation
- Athletes in Team Sports (8-17) / 28.7M
- Source / ESPN
More kids play sports than the populations of Texas and Oklahoma combined.
AAU Sports
- Participants / 670,000+
- Volunteers / 100,000+
National Council of Youth Sports (NCYS)
- Members / 200+
- Registered Participants / 60,000,000
62 million people in the United States played at least one Team Sport in 2013. – SFIO Report
High School
National Federation of State High School Associations (NFHS)
- State Associations / 51
- Athletes / 7,667,955
- Schools / 19,153
More people attend interscholastic activities – about 500 million every year – than any other level of competition in sports in America.- NFHS
COLLEGE
NCAA
- Athletes / 472k
- Members / 1,281 schools/institutions, conferences, or other associations
- Teams / 19k
Division I
- Athletes / 170k
- Members / 350
- Teams / 6,000+
Division II
- Athletes / 112k
- Members / 300
- Conferences / 24
Division III
- Athletes / 187k
- Members / 450
- Conferences / 43
Non-NCAA
The Association of Christian College Athletics
- Members / 24
The California Community College Athletic Association
- Athletes / 26k
- Members / 105
The National Junior College Athletic Association (NJCAA)
- Members / 525 schools in 24 regions
The National Christian College Athletic Association (NCCAA)
- Members / 111
The United States Collegiate Athletic Association (USCAA)
- Members / 85
The National Association of Intercollegiate Athletics (NAIA)
- Members / 255
The Northwest Athletic Association of Community Colleges
- Members / 35
List of NCAA Conferences
List of College Athletic Conferences
Professional
Professional sports occupations include athletes, coaches and scouts, umpires/referees/officials, sports-related workers (journalists, agents, organizers), policy makers, and business executives. Sports create 456k jobs across 15+ industries.
The total economic impact of these occupations on earnings is $14.3 billion. Sports jobs have a multiplier of 2.3, which means that for every job, another 1.3 is created through supply-chain effects. This creates a $14 trillion ripple effect that sports occupations have on the US economy. Source / Economic Modeling
Coaches and Scouts
- Size / 243,900
- Projected Size (2022) / 280,100
- Source / US Bureau of Labor
Athletes and Sports Competitors
- Size / 14,900
- Projected Size (2022) / 15,900
- Source / US Bureau of Labor
Umpires, Referees, and Other Sports Officials
- Size / 17,500
- Projected Size(2022) / 18,800
- Source / US Bureau of Labor
Sports Occupation Breakdown
- Athletes/Competitors / 6% of market
- Coaches/Scouts / 53.6% of market
- Gamers, Writers, Runners / 3.4% of market
- Agents, Managers / 10.1% of market
- Related Workers / 20% of market
- Umpires, Referees, Officials / 6% of market
Sports Industries
Sports Coaching
- Size / $5B / 146k employed / 71k businesses
- Products / camps, instruction
Sports Franchises
- Size / $26B / 61k employed / 159 businesses
- Products / ticket sales, advertising, broadcast and other media rights, licensing of rights for use, concessions, merchandise sales
Celebrity and Sports Agents
- Size / $7B / 56k employed / 42k businesses
- Products / professional athletes and sporting organizations
Racing & Individual Sports
- Size / $14B / 68k employed / 4k businesses
- Products / racetracks, individual athletes
Fantasy Sports Services
- Size / $1B / 4k employed / 280 businesses
- Products / fantasy games
Athletic & Sporting Goods Manufacturing
- Size / $9B / 25k employed / 1k businesses
- Products / sporting goods equipment
Protective Sports Equipment Manufacturing
- Size / $283M / 700 employed / 70 businesses
- Products / protective equipment
Sporting Goods Wholesaling
- Size / $40B / 64k employed / 15k businesses
- Products / hunting equipment, camping/fishing equipment, teams sports equipment, exercise equipment, golf equipment
Sporting Goods Stores
- Size / $44B / 223k employed / 37k businesses
- Products / sporting equipment, athletic footwear, athletic apparel
Sports Medicine Practitioners
- Size / $21B / 140k employed / 21k businesses
- Products / diagnosis and treatment services, rehabilitation services
Physical Therapy
- Size / $31B / 300k employed / 93k businesses
- Products / physical therapy, diagnosis and treatment services, rehabilitation services, injury prevention
Sports Stadium Construction
- Size / $6B / 15k employed / 1.9k businesses
- Products / construction, additions, alterations, and reconstruction, maintenance and repair
Gym, Health & Fitness Clubs
- Size / $27B / 583k employed / 30k businesses
- Products / training facilities, gyms, pools, studios, spas
Gym & Exercise Equipment Manufacturing
- Size / $2B / 6k employed / 228 businesses
- Products / training equipment, weights, machines
Civic, Social & Youth Organizations
- Size / $17B / 275k employed / 44k businesses
- Products / special interest groups, youth organizations, education groups, community and support groups
Ski & Snowboarding Resorts
- Size / $3B / 78k employed / 338 businesses
- Products / skiing facilities, concessions, ski schools, equipment rental, merchandise
Golf Courses and Country Clubs
- Size / $23B / 298k employed / 10k businesses
- Products / memberships, course use, concessions, equipment rentals and sales, other sales and services
Golf Driving Ranges and Family Fun Centers
- Size / $9B / 96k employed / 16k businesses
- Products / driving ranges, sports arcades, miniature golf, shoot ranges, training facilities
Bowling Centers
- Size / $3B / 72k employed / 3.5k businesses
- Products / open play, leagues, equipment rental, concessions
Arcade, Food & Entertainment
- Size / $2B / 35k employed / 6k businesses
- Products / gaming and entertainment, concessions, admissions, event services
Weight Loss Services
- Size / $3B / 56k employed / 30k businesses
- Products / weight loss services, merchandise
Sports Video Game Publishing
- Size / $2B / 10k employed / 1.6k businesses
- Products / video games
Advertising Services
- Size / $34B / 171k employed / 13.5k businesses
- Products / advertising services, creative services, media representation services, public relations services, media planning and buying
Television Broadcasting
- Size / $38B / 121k employed / 936 businesses
- Products / news, sports
Television Production
- Size / $37B / 86k employed / 6.7k businesses
- Products / programming
Social Network Game Development
- Size / $6B / 38k employed / 2k businesses
- Products / software
Internet Publishing and Broadcasting
- Size / $27B / 75k employed / 38k businesses
- Products / advertising space, subscriptions and sales, IP licensing, user information sales
Social Networking Websites
- Size / $9B / 57k employed / 7k businesses
- Products / casual social networks, professional networks, blogging networks, niches
Digital Advertising Agencies
- Size / $12B / 62k employed / 5k businesses
- Products / seo, display, advertising services
Online Event Ticket Sales
- Size / $4B / 2.8k employed / 274 businesses
- Products / online ticket sales for sporting events
Magazine Publishing
- Size / $38B / 129k employed / 5.3k businesses
- Products / entertainment and academic magazines
Newspaper Publishing
- Size / $32B / 217k employed / 4k businesses
- Products / print advertising, digital advertising, sales and subscriptions, printing services
Media Buying Agencies
- Size / $6B / 22k employed / 1k businesses
- Products / print media, tv, radio, cable/satellite tv, internet services
Radio Broadcasting
- Size / $17B / 103k employed / 3.4k businesses
- Products / programming
Media Representative Firms
- Size / $4B / 17k employment / 1.5k businesses
- Products / media representation
News Syndicates
- Size / $3B / 9k employed / 300 businesses
- Products / media and broadcast